
Introduction
In trading theory, confluence refers to the strategic use of multiple technical analysis tools to confirm and filter trading signals. By combining indicators, trend lines, key levels, Fibonacci retracements, and price action patterns, traders aim to enhance the accuracy of their trades and minimize risks.
This guide will explain the principles of confluence trading, common tool combinations, and practical strategies for effective implementation.
Major Takeaways
- Confluence trading enhances decision-making by using multiple technical analysis tools.
- Combining indicators helps reduce false signals and improve trade accuracy.
- Popular combinations include trend indicators, oscillators, support and resistance levels, and Fibonacci retracements.
- Balancing the number of tools used is key to avoiding conflicting signals.
What is Confluence in Trading?
Confluence trading involves using several indicators or strategies to improve the effectiveness of trading signals. For instance, combining moving averages with price action patterns can create a more reliable entry or exit point.
Key Benefits of Confluence Trading
- Confirmation of Signals: Indicators validate each other, providing stronger signals.
- Increased Accuracy: Using multiple tools improves the accuracy of predictions by filtering out false signals.
- Risk Reduction: Confluence can reduce the risk of entering trades based on a single unreliable signal.
Common Combinations in Confluence Trading
1. Multiple Technical Indicators
Different indicators can be used together to confirm market signals:
- Same Indicator with Different Settings: For example, using moving averages with different periods (short, medium, and long-term) to confirm trends.
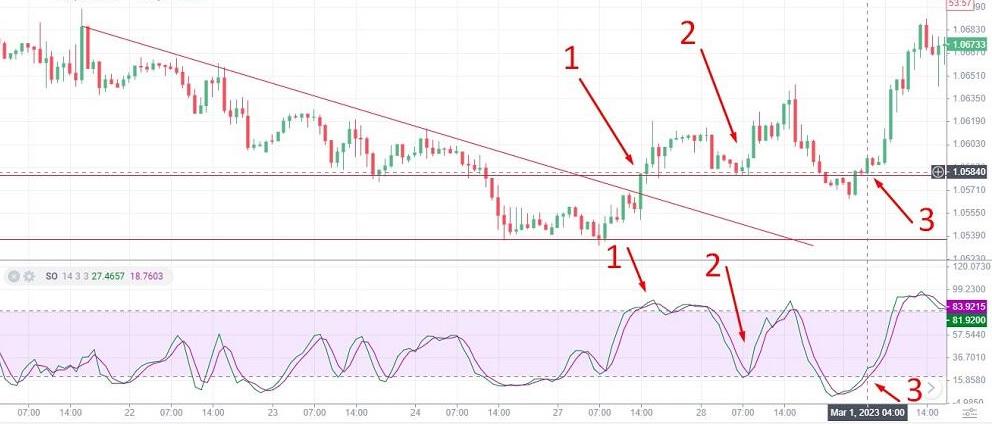
- Trend Indicators and Oscillators: Trend indicators provide directional signals, while oscillators help detect overbought and oversold conditions.
2. Indicators and Graphical Analysis
Combining indicators with support and resistance levels, trend lines, and Fibonacci levels can provide additional validation for trades.
3. Multi-Timeframe Analysis
Using indicators across different timeframes can provide a clearer view of market trends. For example, confirming a daily trend with hourly chart signals can lead to better trade entries.
4. Fundamental and Technical Analysis
Fundamental data such as economic reports can align with technical signals, providing confluence. For example, a rate hike announcement that strengthens a currency may coincide with a technical breakout.
How to Identify Confluence in the Market
Confluence occurs when multiple indicators generate similar signals within the same timeframe or price zone. For example, if a moving average crosses over a trend line near a support level, this alignment strengthens the validity of the signal.
Acceptable Time Gaps
- Short-Term Strategies: In scalping, signals must align within one or two candles to avoid late entries.
- Long-Term Strategies: For swing trades, signals can form over several candles without affecting trade accuracy.
Examples of Confluence Trading
1. Support and Resistance Confluence
Combining horizontal levels with trend lines can create powerful confluence zones for trade entries.
2. Moving Average Crossover with Support Levels
A common strategy involves waiting for a moving average crossover to coincide with a support or resistance breakout, filtering out false signals.
3. Fibonacci Retracement Confluence
Fibonacci retracement levels often coincide with key support or resistance levels. If the price respects a Fibonacci level and forms a reversal pattern, it may signal a high-probability trade.
4. Trendline and Price Action
When a trendline breakout aligns with a price action reversal pattern, it strengthens the trade’s validity.
Pros and Cons of Confluence Trading
| Criteria | Pros | Cons |
|---|---|---|
| Signals | Improved accuracy and higher success rate | Fewer signals may lead to fewer trading opportunities |
| Risk Level | Reduced false entries when tools align | Risk of confirmation bias and over-complicating trades |
| Profitability | Potential for higher profitability by avoiding losses | Fewer signals could reduce the number of trades made |
How to Build a Confluence-Based Trading Strategy
To create an effective confluence trading strategy:
- Select a primary indicator (e.g., moving average or trendline).
- Choose complementary tools (e.g., oscillators or Fibonacci levels).
- Test the strategy on historical data using a demo account to validate effectiveness.
- Adjust based on results, removing any conflicting tools that reduce accuracy.
Conclusion
Confluence trading improves trading outcomes by combining multiple indicators and analysis tools. It filters out false signals, confirms trends, and enhances confidence in trade decisions. However, it’s essential to find the right balance of tools to avoid conflicting signals or over-complicating the trading system. By testing strategies and refining combinations, traders can build a well-rounded, high-probability trading approach.
FAQs
Q: What is the main purpose of confluence trading?
A: To increase the probability of successful trades by confirming signals from multiple sources.
Q: Can beginners use confluence trading?
A: Yes, but they should start with simple combinations, such as trend indicators and support/resistance levels.
Q: How many indicators should be used in confluence trading?
A: Ideally, 2-4 complementary indicators to avoid signal conflicts and maintain clarity.